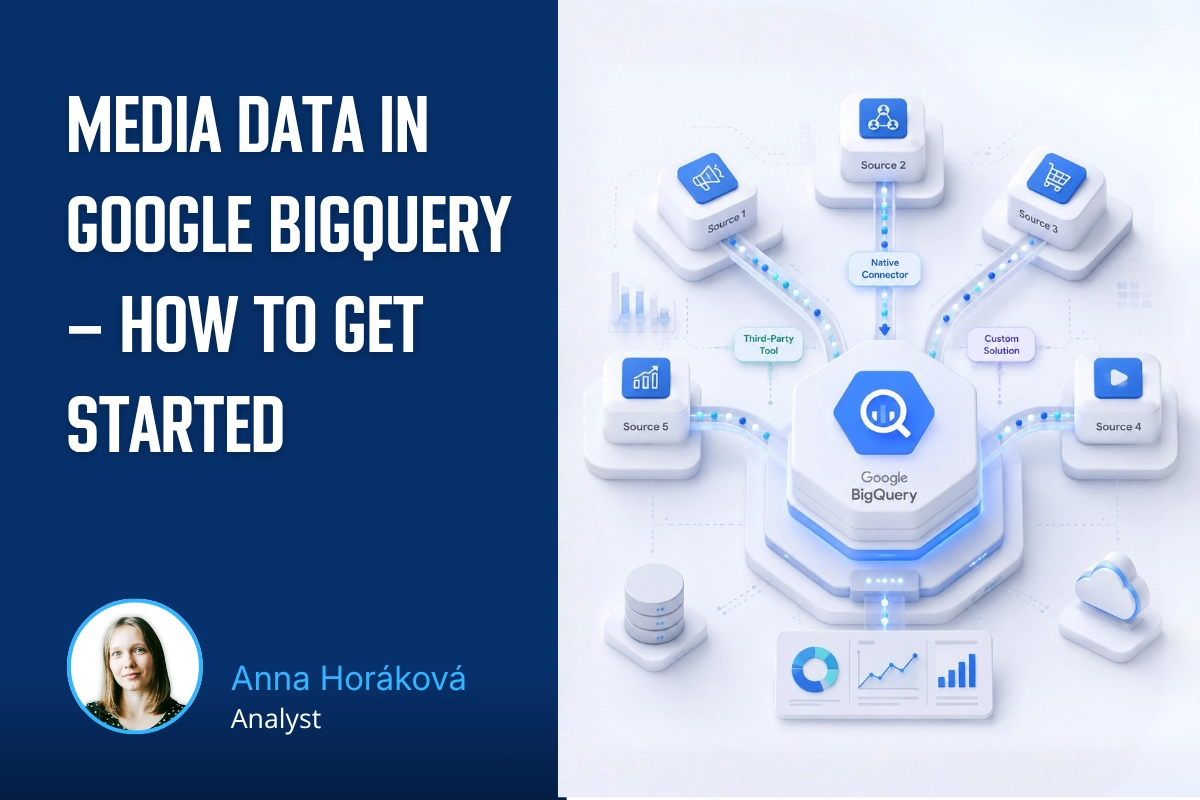
How do you get data from multiple ad platforms into a single data warehouse, typically BigQuery? We’ll walk through the core architecture and key decisions before you start exporting data from Google Ads, Meta Ads, Sklik, and other platforms.
I can’t think of a single client who doesn’t use at least one advertising platform. And once you’re working with several of them, sooner or later you’ll face the question of how to bring all that data together in one place.
This article kicks off a series on how we build these pipelines. In the upcoming articles, I’ll cover Google Ads, Meta Ads, Sklik, and DV360 individually, but several principles apply across all platforms. Architecture options, identity management, data backfills, and metric calculations are better explained in one place, so we can simply refer back to them in the articles that follow.
You’ll find the code and additional resources for the entire series in the public repo pub__BQ-media-pipelines-GCP.
Three Ways to Connect Your Data
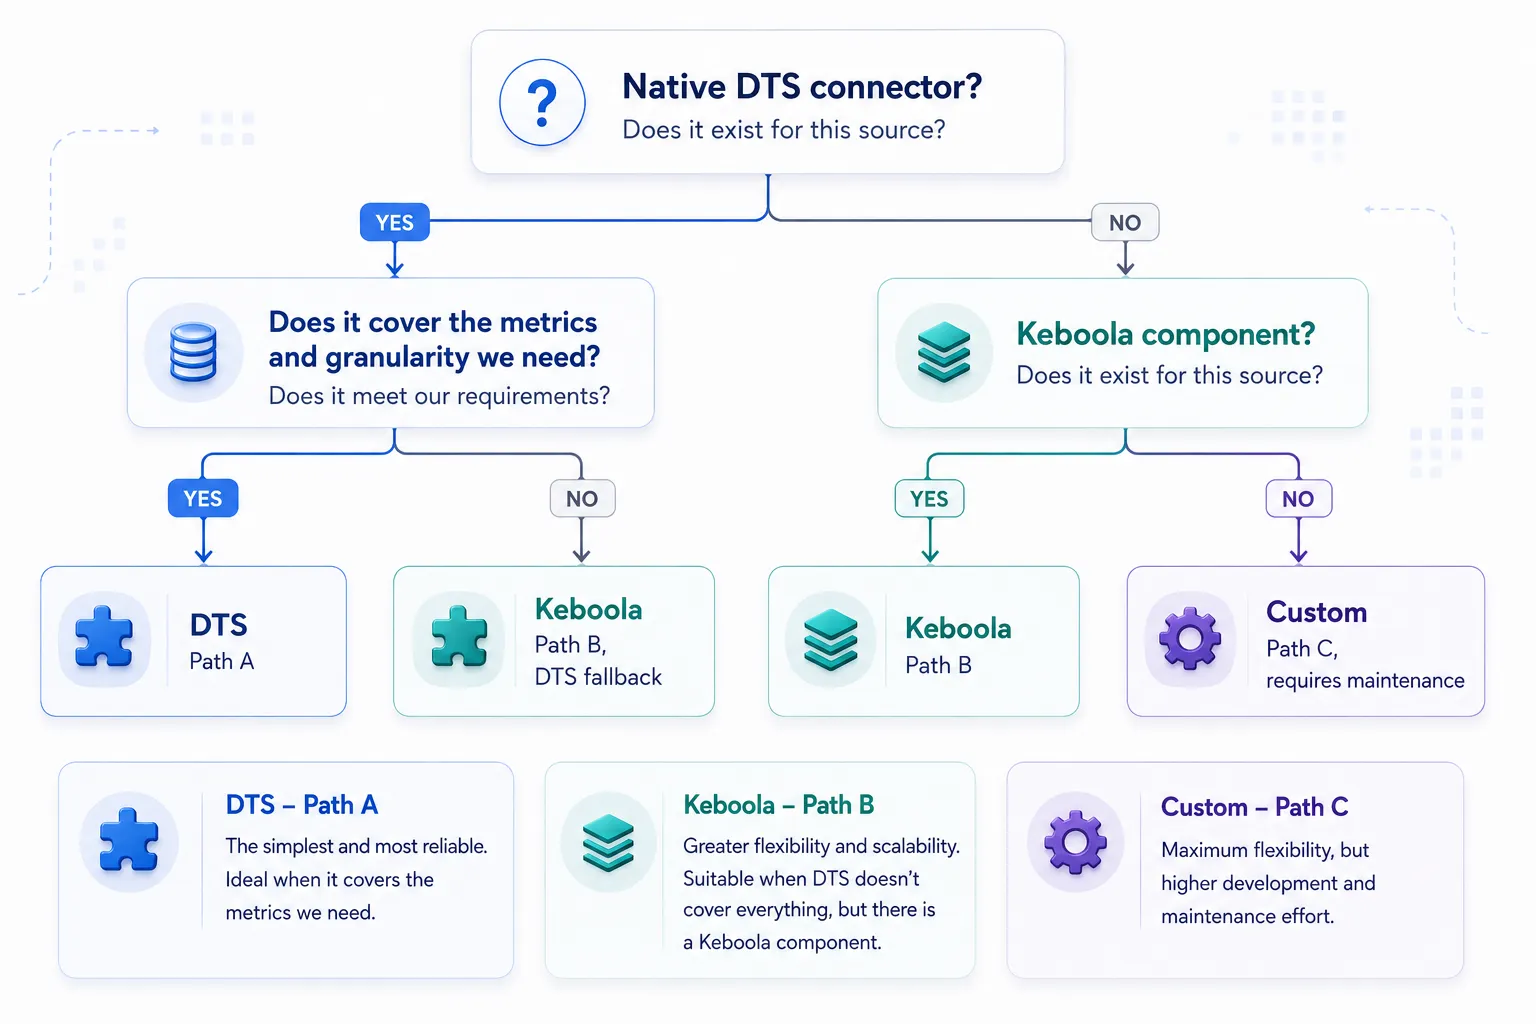
When you want to bring data from an advertising platform into BigQuery, you essentially have three options. The order in which I list them reflects how often we choose each one in practice.
A) Native Connector (BigQuery Data Transfer Service)
Google provides a set of prebuilt connectors directly in BigQuery. They currently support Google Ads, Meta Ads, DV360, YouTube, and several other services. Setup is handled in GCP.
When we use it:
Whenever a native connector is available and covers the metrics we need. For Google Ads, it’s the obvious choice. For Meta Ads, this was debatable for a long time, but with the new version of the connector, the native solution is now our preferred option as well.
What you need to know:
Each connector has its own specific limitations – refresh window, granularity, available tables… Every data transfer has its own specifics, and you need to keep them in mind when building pipelines.
B) Third-Party Tool as an Intermediate Layer (Keboola)
At MeasureDesign, we did fairly extensive research – followed by an even more extensive discussion – on which tool to use. One thing that worked in Keboola’s favor was its Sklik component, since Sklik, Seznam’s advertising platform, is commonly used by most of our clients. Similar tools are available (Fivetran, Supermetrics, Stitch, Airbyte), but in our context, Keboola has proven to offer a good combination of lower costs, a sufficiently broad connector catalog, and solid UX for the transformation layer.
When we use it:
The advertising platform doesn’t have a native connector to BQ (Sklik, LinkedIn Ads, Pinterest Ads).
A native connector exists but doesn’t support a specific type of export – this used to be an issue with Meta, but its native connector now offers enough options.
What you need to know:
Keboola isn’t free. For a smaller client, the estimated cost is around CZK 300 (approx. €12) per month; for larger clients, it can be higher.
It’s another component in the pipeline that can break, and another account that needs to be managed.
C) Custom Solution
A Cloud Run service / Cloud Function that calls the advertising platform’s API, processes the response, and writes the data to BQ. Maximum flexibility, independence from third-party providers, and full control over the schema.
When we use it:
Only when neither option A nor B is suitable. The reason isn’t elegance, but economics. A custom pipeline needs to be built, tested, monitored, and maintained when the provider’s API changes. For a single data source, it only makes sense if neither Keboola nor DTS is sufficient and the client is willing to pay for maintenance.
Practical exception:
File-based sources. If an advertising platform sends data as files (CSV) to a GCS bucket, the disadvantages of an API-based solution disappear, and a custom pipeline with a Cloud Run trigger on file arrival is often the simplest option. This is common, for example, with Adjust for mobile app measurement.
Decision Framework
Service Account as the Default Identity
This is the most important section across the entire series. Whenever you see “set up a service account and assign the required roles” in the upcoming articles, refer back to this section.
Why Not Use a User Account?
By default, most DTS connectors use the identity of the user who sets up the transfer. This works, and subsequent runs are authenticated under that account. The problem arises when:
The user leaves the company or the client and their account is deleted.
The user loses access to the advertising account (access revoked in Google Ads or removed from Meta BM).
The user loses access to the GCP project.
In all of these cases, the pipeline quietly stops working. No error email arrives. Unless you have at least basic monitoring set up, notifications are sent by default only to the user who created the transfer – the same user who no longer has access to the asset. The data stops coming in, and no one notices until someone opens the reporting and starts asking why there’s no Google Ads data for the past two weeks.
A service account, on the other hand, is an independent identity. It belongs to the project, not to a person. It lives as long as the pipeline does. It can be managed centrally, easily “handed over,” and the logs make it immediately clear that an action was performed by the SA.
Granularity: One SA per Data Source
An SA for Google Ads doesn’t need access to Meta Ads, Sklik, or DV360. Every additional permission increases the risk of errors – if someone accidentally revokes the SA’s access or misconfigures it, multiple pipelines can fail at once. Recommended naming convention:
GCP Console → IAM & Admin → Service Accounts → Create service account. Name it according to the naming convention and add a description.
Do not create a JSON key. It isn’t required for DTS – authentication is handled through IAM impersonation.
Give the SA Access to the Target BQ Dataset
Open the dataset for the relevant advertising platform → Sharing → Permissions and add the SA email (format: sa-googleads-<client>@<project>.iam.gserviceaccount.com) with the following role:
roles/bigquery.dataEditor – permission to write to tables in the dataset.
At the project level, the SA also needs:
roles/bigquery.jobUser – permission to run jobs.
Give Yourself Permission to Impersonate the SA
GCP Console → IAM & Admin → Service Accounts → click the SA you created → Principals with access:
Principal: your user email
Role: roles/iam.serviceAccountTokenCreator
Without this step, the DTS UI won’t let you create a transfer under the SA. If you see the error “permission denied to act as service account,” you’re missing this role.
Note: In some contexts (Scheduled Queries, Dataform workflows, Workflows), you also need to add roles/iam.serviceAccountUser in addition to serviceAccountTokenCreator. For DTS via the UI, Token Creator is sufficient, but if something fails with a “permission denied to act as” error, add ServiceAccountUser as well.
Alerting When Using a SA
By default, DTS notifications are sent to the email address of the user who created the transfer. If the transfer runs under an SA, these notifications effectively go nowhere – an SA doesn’t have an inbox. You therefore need to set up at least basic alerting – we’ll cover this topic in an upcoming article.
Backfill as a Separate Operation
Most DTS connectors use a daily incremental approach – each day, the partition for that day is overwritten (along with the partitions covered by the refresh window for the previous X days, where applicable). In many cases, this is sufficient, but it doesn’t cover situations where we need to backfill data for the past several months rather than only collect data from the date the transfer was set up.
DTS supports backfills through the UI (Schedule backfill), but with significant limitations:
Individual days are scheduled roughly 45 minutes apart. For a 90-day backfill, that means around 68 hours of queue time.
You can’t start a new backfill while previous runs are still queued.
With some connectors, you can’t select multiple consecutive days for a backfill at once.
A practical solution that works for us: a bash script using the bq CLI that goes through the specified period day by day, waits for the connector to become available before each new day, and only then starts the next run.
The full version of the script, including a wait timeout (so it doesn’t keep running indefinitely overnight if a run gets stuck), is available in the repo as DTS_backfill_terminal.bash.
Practical recommendation: even with this script, avoid running a backfill over a very long period all at once. It’s better to split it into 10–14-day windows and run it multiple times if needed.
Refresh Window
The default values provided by Google in the UI are almost always insufficient. For Google Ads, the default is 7 days; we typically use 14–30. For Meta DTS, the default is just 1 day, but depending on the reporting window, you can set it to as much as 28 days. The reason is late-arriving attribution data – conversions attributed today through a 7d_click window belong to a partition from 7 days ago; if the refresh window only covers the last 1–2 days, that data will never be updated.
Data Layers: L0 / L1 / L2
Throughout the series, we use a layered architecture, but for purely media data, we mostly work with raw exports and the L0 layer – minimal transformations, limited to standardizing table names, handling NULL values with IFNULL, adding constants (market, platform), and joining metadata (campaign names) to performance metrics.
Importantly, L0 usually serves directly as the reporting layer – for a standalone view of a single platform, there’s typically no need to build anything else. Higher layers come into play when we need to transform media data further or connect it to other sources: L1 (staging/normalized) standardizes data across platforms into a common model (consistent column names, data types, currencies, etc.) and handles things like currency conversion and deduplication; L2 (mart/reporting) is then an aggregated layer for a specific report or a dataset combining multiple sources.
Validating Data Against the Platform UI
After the first run, always verify that the numbers in BQ match what you see in the source platform’s UI.
What to Validate
It’s not enough to compare only the total spend. Validate at the level you actually report on: spend, impressions, and clicks per campaign per day. The aggregate can match by chance (two errors may cancel each other out), while a more granular breakdown can reveal a systematic discrepancy.
What Time Period to Validate
Validate using data that is at least around 14 days old (ideally more than 30 days). Most advertising platforms continue to adjust recent data from the last few days – conversion adjustments, corrections, later aggregations – so a discrepancy between BQ and the UI in yesterday’s data doesn’t necessarily indicate a pipeline issue; the numbers may simply not be final yet.
Data older than two weeks is generally more stable (at least when it comes to impressions, spend, and clicks; conversions may still change), so any discrepancy is a more reliable indicator of an actual problem.
Before You Panic About Something Not Matching…
Timezone and currency should be your first suspects. Most discrepancies that aren’t caused by a bug in the pipeline come down to two things: the UI reports in a timezone other than UTC (shifting spend by a day) or in a different currency (MCC currency vs. child account currency). Before looking for an error in the SQL, make sure you’re comparing the same timezone and the same currency.
Validate Regularly
Validate after every schema change, not just during the initial setup. A one-time validation at the beginning isn’t enough – if Google or Meta changes the schema or renames a column, the pipeline may silently start pulling data differently. It’s worth making validation a repeatable step rather than a one-off task. It’s also a good idea to periodically (for example, once a month) compare key metrics from the platform UI against the exported data.
What’s Next in the Series
This article provides a general framework for working with media data in GCP. In the upcoming articles, we’ll look at the specific setup and considerations for each platform.
Who is behind the article
Anna Horáková
Analyst
Anička worked in data analytics at MeasureDesign, connecting data with GA4, BigQuery and Looker Studio. She was part of our team until 2026.
Working on the go has its benefits, but also a few practical challenges. I’m sharing the setup I’ve fine-tuned over the years that lets me work comfortably from anywhere – from connectivity and a second monitor to ergonomics.
What should a PPC specialist know about analytics and data collection? In our workshop for uLab, we covered the entire chain, from the technical components of tracking and media platforms to collecting and activating first-party data.
How do you get data from multiple ad platforms into a single data warehouse, typically BigQuery? We’ll walk through the core architecture and key decisions before you start exporting data from Google Ads, Meta Ads, Sklik, and other platforms.
Part 3 of our first-party data series gets technical again – we'll show you how to check that data is correctly reaching each system and doing what it should. We'll look at outgoing hits in DevTools and at checks directly in the ad platforms.
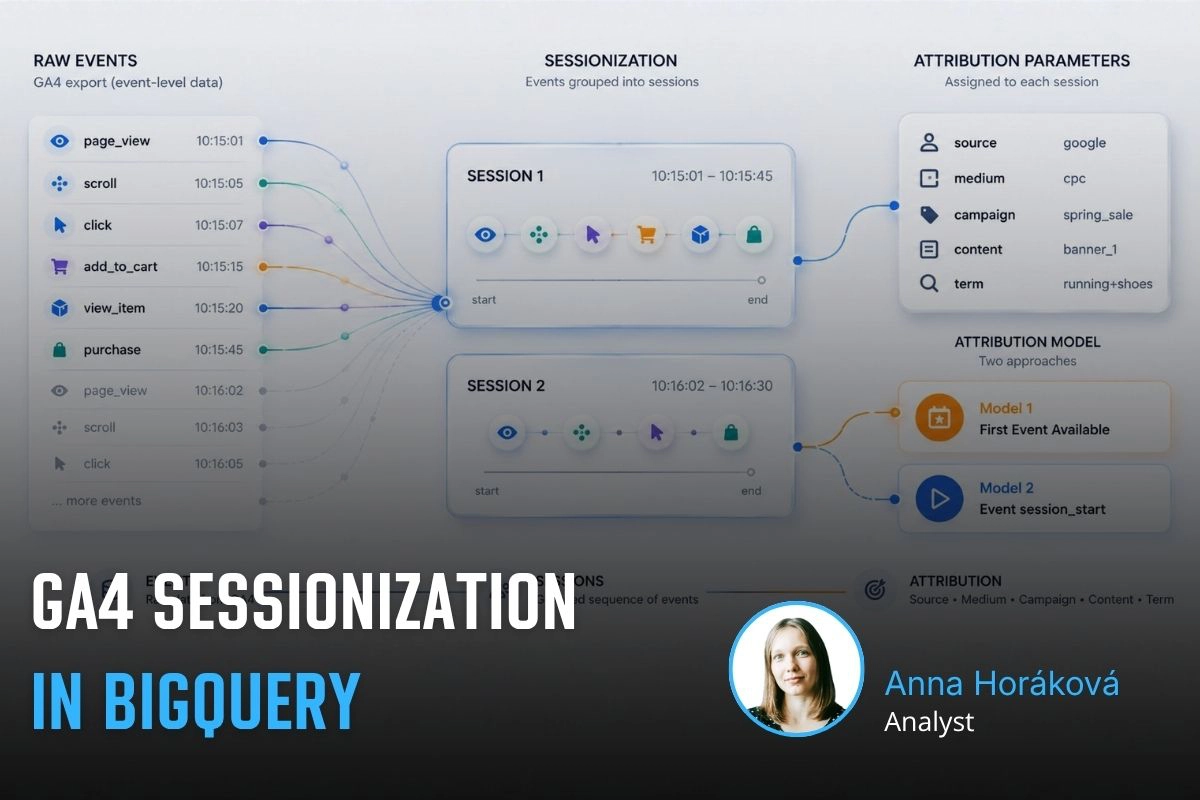
A detailed guide to sessionizing the GA4 BigQuery export — from identifying sessions and reliably ordering events to two attribution models (First Event Available and Session Start), their limitations, and validating agreement between them.
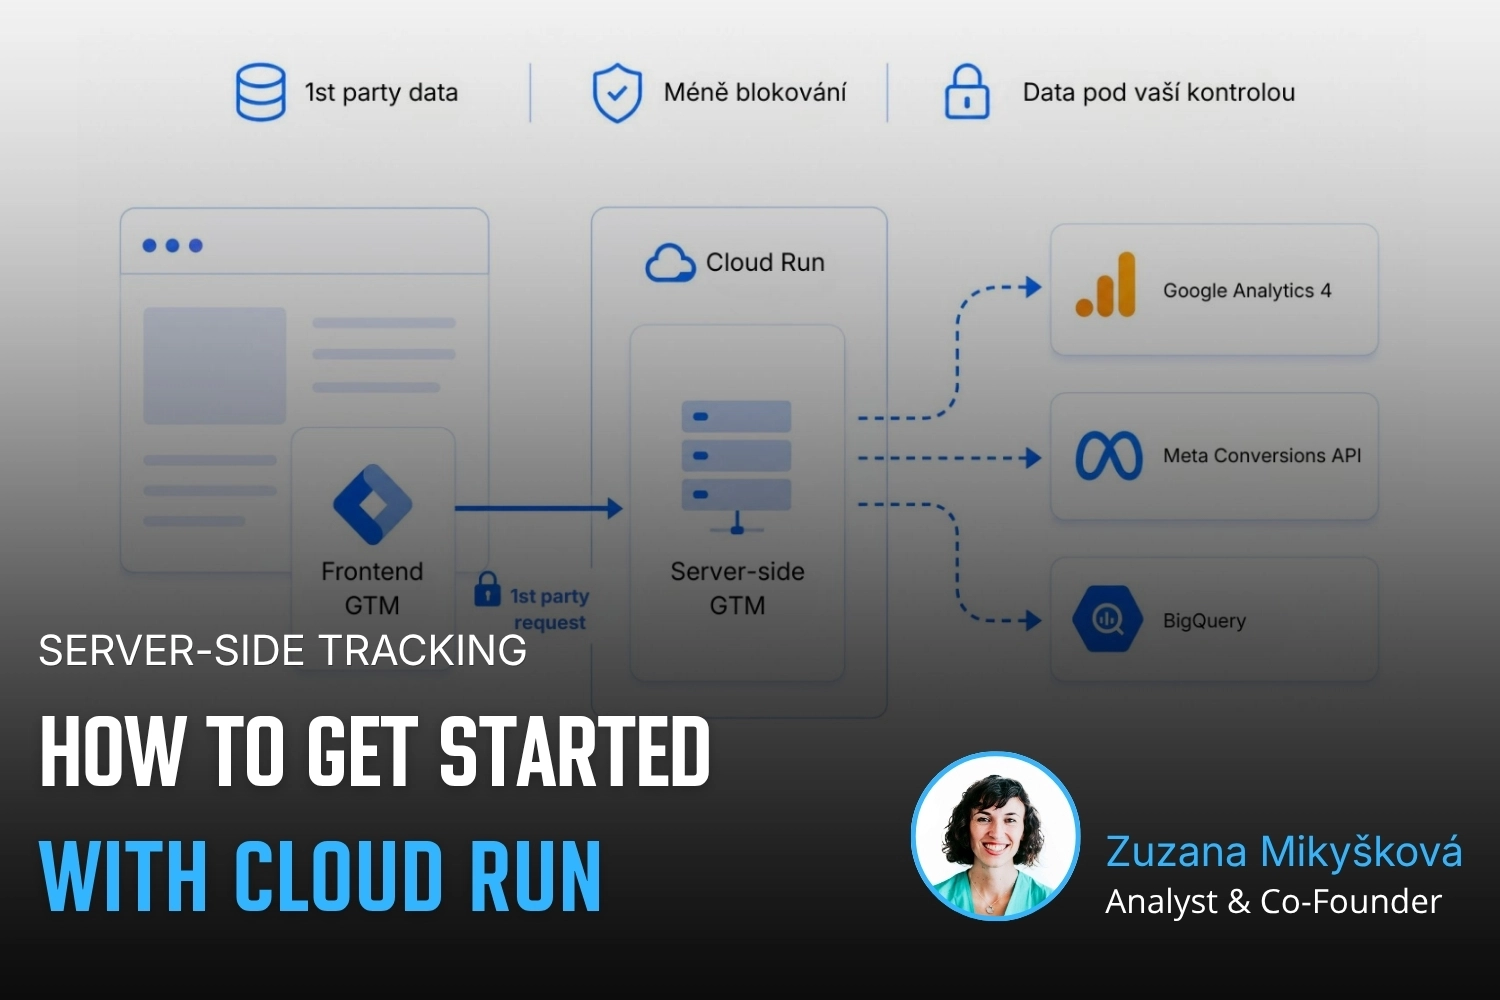
Learn how to deploy server-side tracking on Google Cloud Run. Compare Stape vs Cloud Run, configure load balancers, choose billing types, and test your setup.
Complete technical guide to collecting first-party data via dataLayer, normalizing, hashing, and sending through server-side GTM to Google Ads and Meta.
Testing ClickUp MCP: hands-on experience with AI-powered automation, security concerns with access tokens, practical limitations, and who should use it.
Learn how first-party data improves campaign performance, measurement accuracy, and cross-device tracking. Discover practical ways to collect and use it.
Workshops on advanced digital analytics: BigQuery, cookieless tracking, consent, attribution, and building data warehouses for reporting and activation.
Why analytics is an excellent career for women, including those returning from maternity leave. A personal story about transitioning into data analytics.
A look back at Reshoper - advising e-shop owners on tracking and measurement, plus a roundtable on marketing automation with insights on self-hosted N8N.
From Idea to App in 48 Hours 🚀 Building AI-powered apps at #HackYourWeekend using Claude Code, tracking with BigQuery, and lessons from team development.
Recap of PPC Camp: my presentation on legally measuring data without user consent - cookieless tracking, sGTM, BigQuery, Facebook conversions, and Advanced Consent Mode risks.
Ready-to-use BigQuery SQL script to calculate Easter dates (2024-2100) using Computus algorithm. Perfect for filtering GA4 data and analyzing seasonal trends.
GA4 + BigQuery in practice: connecting analytics, CRM & media data, real-world use cases from IKEA, Shoptet, McDonald's & Česká spořitelna, and what it unlocks for marketing.
Vašek and Anička presented at MeasureCamp Prague on using Google Ads export in BigQuery, combining it with GA4 and CRM data to solve attribution issues.
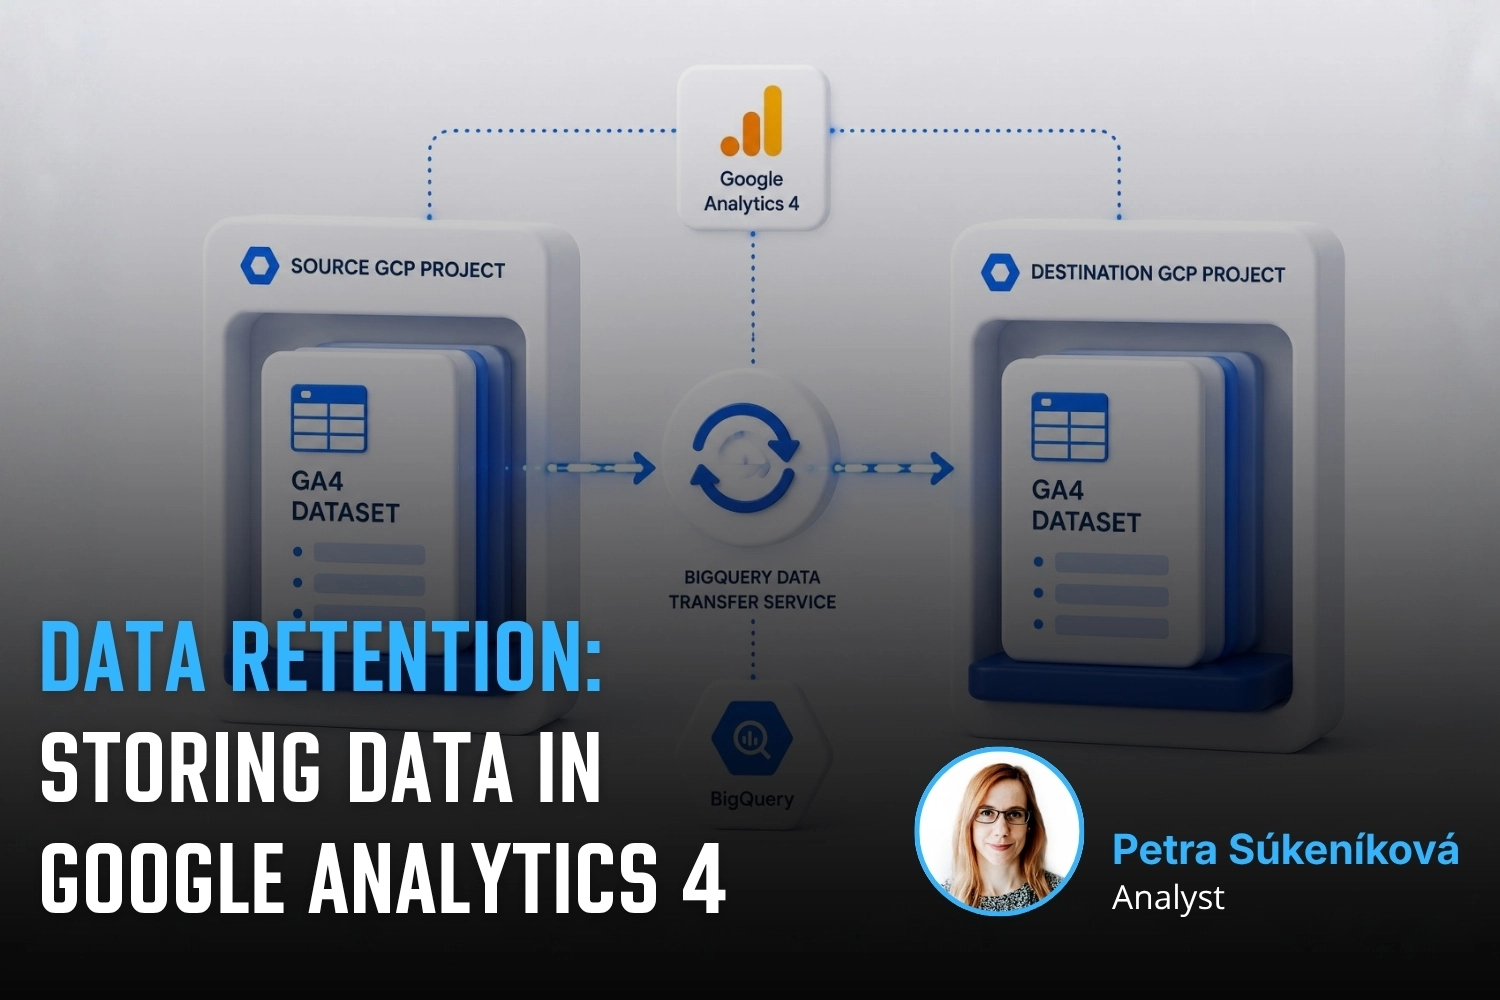
Learn how to extend GA4 data retention from 2 to 14 months. Understand what retention affects, how to change settings, and what happens after data expires.
Public webinar on evaluating campaigns using GA4 dataset in Google BigQuery. Featuring Vašek Ráš and Honza Tichý on DBT, SQL queries, and data flattening.
Jana focuses on UX, content and website development at MeasureDesign, making websites clearer and easier to use. She also designs and builds sites for her own clients and values teamwork and finding solutions together.
Vojtěch Černý
IT & Data Developer
Vojta works at MeasureDesign on developing technical and data solutions that are not only functional, but also practical and easy to use. He enjoys combining web development, automation, and data work to create solutions that make sense both from the user’s perspective and in terms of the technical foundations behind them. What he finds most rewarding is turning a more complex problem into a clean and reliable solution.
Jiří Otipka
Analyst
Jirka has been working in marketing for over 10 years, and if there is anything he enjoys more than numbers themselves, it is connecting them. He loves mathematics and data analytics, and thanks to his interest in exploring source code, he can easily communicate with developers in their own language. At MeasureDesign, he specializes in connecting new data sources - building custom connectors in Python, testing data quality, and exploring which data combinations make the most sense from a business perspective. He is completely at home in Looker Studio and also has extensive experience evaluating PPC campaign performance.
Lenka Pittnerová
Analyst
Lenka joined MeasureDesign at the end of 2025, bringing extensive experience from PPC marketing, where she spent many years working with Google Ads, Meta Ads, and other advertising platforms. While managing campaigns, she repeatedly ran into the same issue - poorly set up or insufficient web analytics, which made effective optimization nearly impossible. This challenge initially led her to analytics out of necessity, but over time she discovered that she enjoyed it even more than advertising itself. Today, she focuses primarily on implementing web analytics and data solutions that provide companies with high-quality, reliable data for strategic decision-making and performance marketing. She continues to work on selected PPC projects as well - not only because she still enjoys them, but mainly to stay closely connected to the reality of media platforms and the real needs of clients.
Martina Kvasničková
AI & Data Research
Marťa helps integrate AI into everyday work—making it faster, more efficient, and accessible to every team member. What excites her most is finding practical ways to use AI and turning new technologies into useful tools.
Anna Horáková
Analyst
Anička has over 7 years of experience in the agency world, where she has managed social media ad campaigns for clients, and especially for content-driven websites, her favorite. Wanting to broaden her perspective beyond campaign data, she gradually shifted her focus toward web analytics. She joined our team in 2022 and now specializes in data analytics, using GA4, BigQuery, Looker Studio, and other tools to connect and dig deeper into data — delivering insightful analyses and valuable input for business decisions. Anička was a member of our team until 2026.
Zuzana Mikyšková
Analyst & Co-Founder
Zuzka's career path led her through corporate innovation and research management, running word-of-mouth projects, and later to a digital agency, where she managed website development projects. However, Zuzka is naturally curious and wanted to understand how a website actually works once it is launched into the world. That curiosity led her to study web analytics — and eventually to a key collaboration with Vašek. In 2019, they founded the company together.
Vašek Jelen
Lead Analyst & Co-Founder
Vašek has been working in digital analytics for over 15 years — from setting up tracking to data storage, visualization, and interpretation. He helps companies keep their data in order and make full use of it. He focuses primarily on data from digital platforms such as websites, apps, and client zones, and on connecting that data with other business data like media and customer data. After years of freelancing, he co-founded the analytics studio MeasureDesign, where, in addition to working on analytics projects and bespoke training sessions, he also mentors and educates new analysts.
Blanka Hejduková
Back Office
Blanka joined our team in 2024 and has been responsible for back-office operations, including invoicing and administrative tasks, ever since. She draws on her experience from the Czech Post and her background in financial management to keep everything running smoothly. In her free time, she enjoys traveling with her two children and finds relaxation in working in her garden.
Markéta Svěráková
Analyst
Markéta started out in marketing, but then came maternity leave — and with it, total chaos. In an effort to hold on to the last bits of sanity, she turned to data. After all, numbers don’t yell, spill cereal into your keyboard, and at least they make some sense. She completed a data analytics course at Engeto Academy, where she bonded with SQL, Power BI, Excel, and Python, and started looking for patterns outside the bounds of children’s coloring books. Today, at MeasureDesign, she helps clients understand what their numbers are really saying.
Petra Súkeníková
Analyst
She joined MeasureDesign in 2023, specialising in measurement implementation and reporting. Her favourite moment is when, after all the setup and testing, the first data finally starts flowing in. Her biggest challenge? The unexpected (and often undocumented) changes from Google – those are the times when every analyst turns into a paranormal behaviour expert. 👻 She was a member of our team until summer 2026.
Klára Belzová
Analyst
Klára has been with the company since 2019. She focuses mainly on web analytics but is not afraid to dive into data work in BigQuery. What she enjoys most is guiding clients through the entire process — from defining their needs to implementing tracking and creating the final data visualizations.
She gets an almost suspicious amount of joy from a clean and well-organized GTM container or a report full of useful data.